JLR
This user hasn't shared any biographical information
Posts by JLR

JCPenney’s Latest Tweet Stirs Up Mixed Thoughts
Feb 1st
I just received the following Tweet from JCPenney…
Honestly, the first thing that struck out to me was the use of the word “Tweeps.” Now, I don’t know if I’m thinking about this too much, but is “tweeps” being used appropriately in this context? According to UrbanDictionary.com, Tweeps is defined as:
- Tweep (or The Tweep) is a nick-name given to Michael Grosheim by Twitter Followers and Facebook Friends. Michael is the owner of TheSocialTweep.com.
- A “tweep” is a Twitter user who is a rookie or a novice by virtue of their low number of tweets. It is also someone on the bottom of the Twitter hierarchy. The opposite of “tweep” is “twitterian.”…
- Twitter Creep
- A plaintive cry, usually on twitter: so a cross between tweet and weep.
I personally see the word “Tweeps” as a negative connotation. It is what got me to think in the first place about researching the overall lingo of “tweep.” To me, when I first read it, it gave me a negative feeling and reminded me of the words “twerp” and “creep” meshed together.
Also what’s up with “The Facebook”? Is the brand poking fun at itself by calling Facebook, “The Facebook” and putting it in quotations as if saying, “You know, that thing that everyone uses and you should be on it already but we’re saying it in a way as if it’s something we just learned about and started doing.” I don’t know, I just get an overall negative feeling from this tweet that to me does not help JCPenney’s brand.
When I put together a Tweet or status update for a client, it usually takes me 10-20 minutes to compose it. I take many factors into consideration such as the overall meaning of words like “Tweeps” and how it may come across not only to the general audience, but to those that may not be familiar with the latest Twitter lingo.

It’s Here Again, Subway’s $2 Customer Appreciation 2012 December Deal
Dec 8th
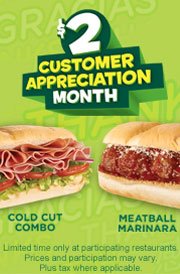
I’m a big Subway Fanatic and eat Subway for lunch most of the time. I tend to stick with the daily deals but for December, I’ll be enticing myself randomly with Subway’s $2 Customer Appreciation Deals.
For the entire month of December, get any of the following 6-inch subs for only $2:
- Cold Cut Combo
The cold cut combo has turkey-based ham, salami, and bologna. The standard sub is below 400 calories.
- Meatball Marinara
This sandwich doesn’t have much variety but if you’re into pizzas, this might fit your tastebuds.
Side-by-Side Nutritional Info
| Cold Cut Combo | Meatball Marinara | |
| Total Calories | 370 | 480 |
| Cal from Fat | 120 | 160 |
| Total Fat | 13g | 18g |
| Cholesterol | 50mg | 30mg |
| Sodium | 1140mg | 950mg |
| Carbs | 46G | 59G |
| Protein | 18G | 21G |
Compare the nutritional info on Subway’s Website:
Cold Cut Combo | Meatball Marinara
Both sandwiches have their pros and cons nutritionally, but if anything I would lean slightly towards the cold cut combo if you’re watching your nutrition.

Why I’m Getting My Mom a Kindle Fire HD Tablet for Christmas
Nov 29th
 I was honestly trying to decide between a Google Nexus 7 or the Kindle Fire HD. For all intent and purposes, it is a very close match between the two. There’s not even a differentiation on price. Ultimately though I had to consider who my target audience is for this special gift… my mom.
Like some baby boomer parents, if not most… being technology savvy is not at the top of her list so I kept that in mind when thinking of what kind of tablet to get her; she’s been asking my thoughts on which one to get for a couple of weeks now so I know it’ll be a perfect gift. I could have gone with the iPad or the iPad mini, but honestly price factor was a concern given how much of the features my mom would probably utilize. So it came down to either the Google Nexus 7 or the Kindle Fire HD.
Sure I can get into the technology specifics as far as processor, ram, etc. However what really matters most to me would be the simplicity of the interface and if my mom could adapt to it easily. This is where I feel the Kindle Fire HD really has an advantage. They have an integrated app and media eco-center built right into the tablet. I know Google has been pushing Google Play and whatnot, but I feel the integration of Google Play isn’t as simple and straight forward as what Amazon has developed with their Amazon Prime program and the integration into their tablets.
After some thoughtful consideration, I’ll be getting my mom a Kindle Fire HD Tablet for Christmas.

How I Got $125 Bonus for Opening a Checking Account with ING Direct
Nov 23rd
 You know me, I’m always keeping an eye out to make best use of my finances. Today I received an email from ING Direct about their Black Friday Special… $125 for opening a checking account. I’ve had my savings accounts with ING Direct since I was a teenager. Today’s interest rates have barely any return, but ING Direct is still leaps higher than the big mortar banks. Additionally, I love their web interface. It’s fairly easy to add additional savings account. I set up a sub-account for each one of my goals.
So how do you get an extra $125? Easy (no huge deposit required)… just make 10 purchases with the debit card they send you. From the looks of it, there’s no minimum purchase per transaction so I’m planning on buying some small lunches to meet my minimum. If you don’t have a checking account yet with ING Direct, open one up by Sunday, Nov 25 and be on your way on earning an extra $125. Also if you use my referral link below, you gain an additional $25 if opening a savings account as well. So overall, you walk away with a $150 bonus.
Click here to Open an ING Direct Account and Score Your Bonus
Personal Workout Challenge: October Performance – Slow But Steady
Nov 2nd
I have not joined a gym yet in order to continue my swimming and thus I’m still depending on a weights regiment with light cardio for my progress towards my goals. Overall I’ve made steady progress but I’m not on track to meet my end of the year goals.
Similar to last month, I met some of my goals but not others. I did quite a bit more pushups and situps this month that probably led to the measurement increase in my chest and neck (at least I think so, don’t know what else it could have been). I set last month’s goals in order to be on track to meet the end of year goals. With that said, although I lost 0.5in in my waist, it was no where near the 1.5 I had hoped to have lost. In the same manner, although I’ve been doing weights, I have not been able to grow the size of my arms; perhaps next month my efforts will begin to take shape in that department. My pushups as well as some contribution from my weight routines have led to a 0.5in increase in my chest which I’m overall glad about. Ironically, either I’m losing quite a bit of muscle, or my thigh keeps hiding fat because every month when I think it can’t get any smaller, it does.
Overall, even though I didn’t meet all my goals for the month, I’m satisfied that I’m still on the right track. The statistics keep improving in a manner that will lead to a more fit lifestyle. At this point I must say that there’s only a small chance that I’ll still meet my end of the year goals but I will be very close to them.
| ABDMN | ARMS | CALF | CHEST | HIP | NECK | THIGH | WGHT | FAT% | |
|---|---|---|---|---|---|---|---|---|---|
| PREVIOUS | 32.0 | 11.0 | 12.75 | 36.75 | 35.5 | 14 | 19.25 | 125.8 | 9.8% |
| GOAL | 30.5 | 11.75 | 13.0 | 37.25 | 35.0 | 14.0 | 20.0 | 125.0 | <=9% |
| ACTUAL | 31.75 | 11.0 | 12.75 | 37.5 | 35.0 | 14.25 | 18.75 | 125.0 | 9.2% |
See Complete Personal Fitness Log
Notes to Consider
- I should remember that even if I don’t meet my goals, I should not be discouraged given that I’ve still made progress and moving in the right direction at a time that it’s so easy to go the opposite way.
- My weight seems to be dropping consistently. If it continues at this same rate, I’ll fall below my end of the year expectation. At this point it’s more about gaining muscle weight to offset the decrease in fat. During my senior year in high school I weighed 118 and that was after a couple of track/cross-country seasons.
Cleaning My Logitech Wave Keyboard in the Dishwasher
Oct 7th
Recently I noticed that my Wireless Logitech Wave Keyboard was beginning to sound a bit loud and that some of the keys were starting to stick. I’ve had my Wave Keyboard for about three years now. In hopes of avoiding replacing it, I figured a good cleaning might solve the issue and what better way to clean something than the dishwasher.
Step 1 – Taking it Apart
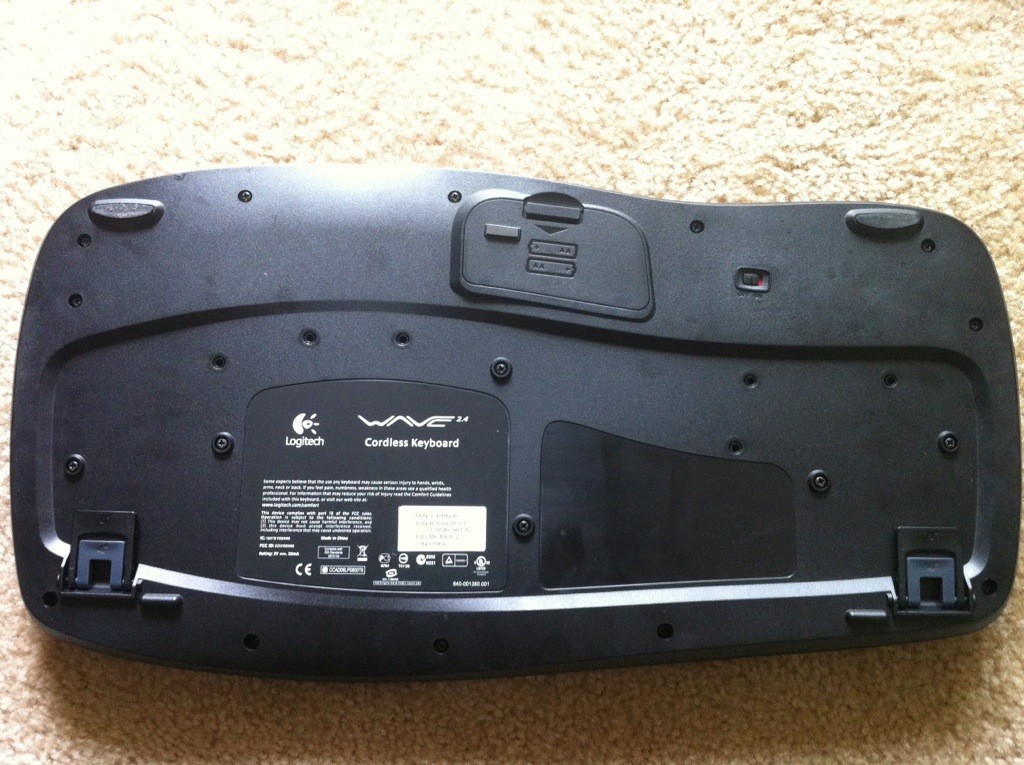
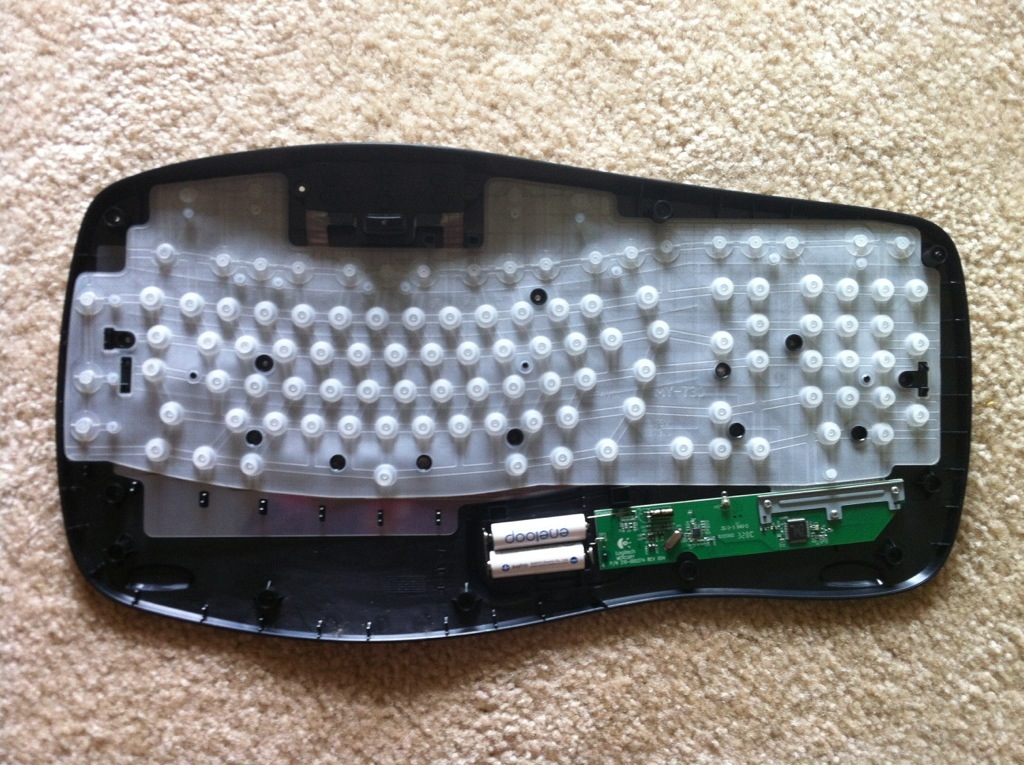
Overall, keyboards are very simple devices. First thing I did was turn off the keyboard and remove all the black screws from the back in order to separate the two halves. This proved quite easy and simple.
Step 2 – Removing the palm rest
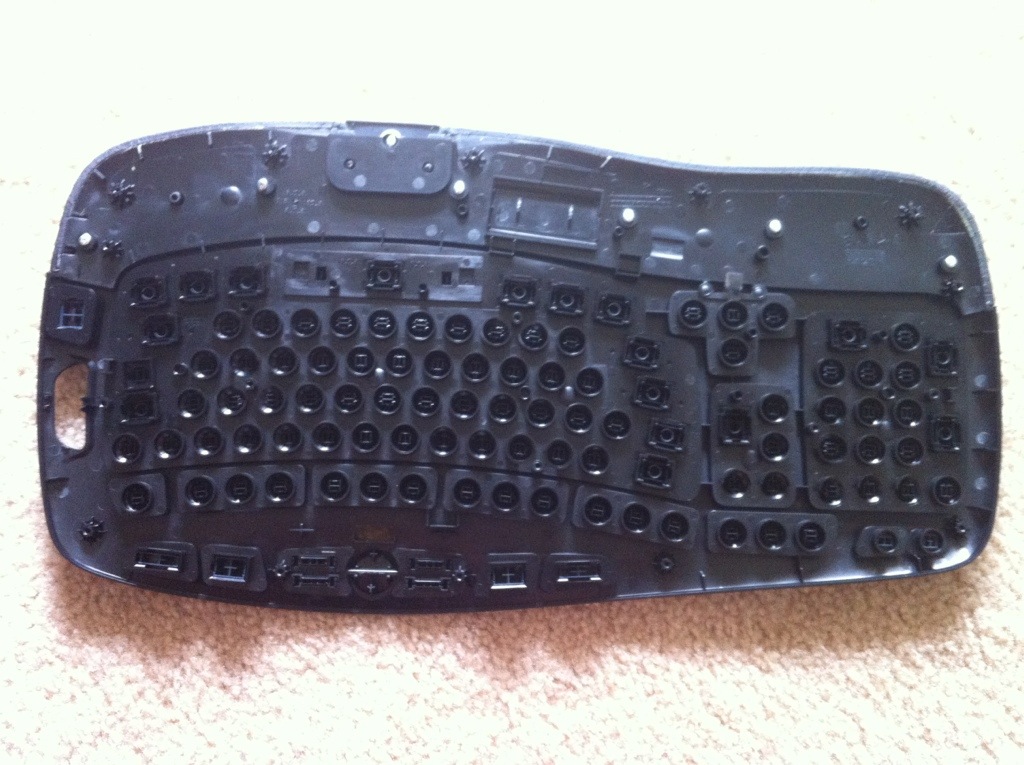
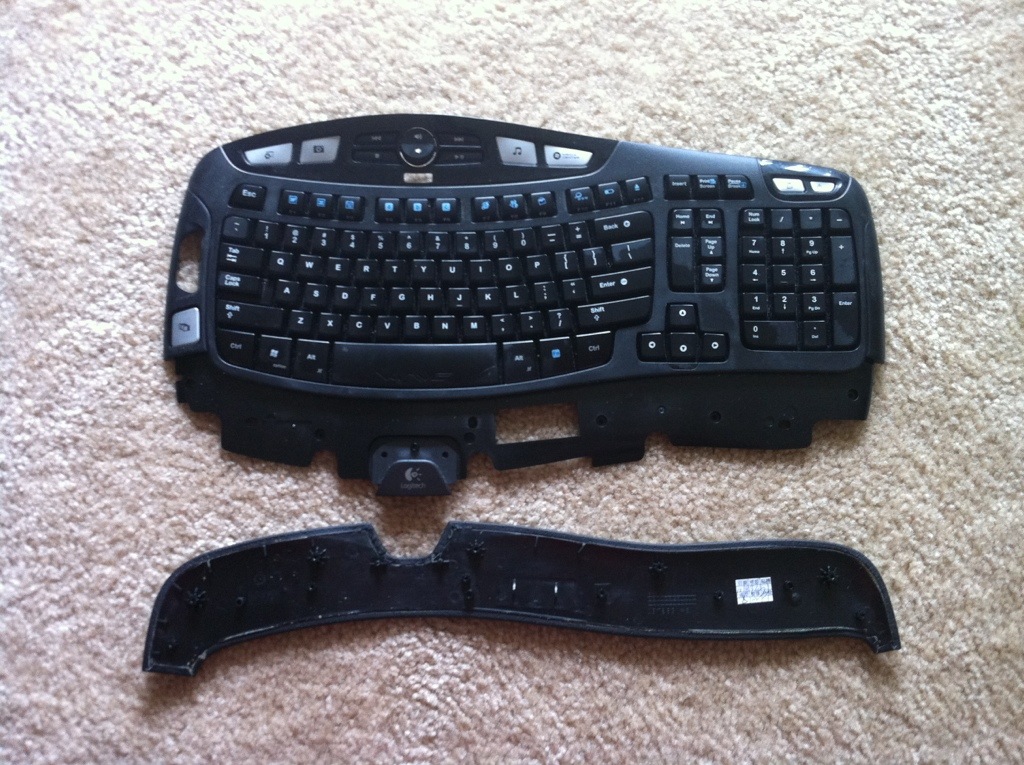
I noticed some silver screws on the inside of the keyboard holding the palm rest in place and figured I would separate that as well.
Step 3 – Putting it in the dishwasher
I placed only the side of the keyboard with the keys facing down on the bottom rack of my dishwasher with the palm rest along side of it. I did not put in the side that had the rubber membrane and circuit board. From my inspection, the issue was not with the membrane and figured a simple wipe down of the rubber with a damp cloth would suffice for that side.
I added some dishwasher detergent, set it to a “Normal Cycle”, closed the hatch and crossed my fingers.
Step 4 – Drying it out
I did not use the heat dry function of the dishwasher. Once it was done, I took out the keyboard components and all seemed okay. No keys had popped off and the letters on them were still visible. I used a blow dryer to speed up the drying time but still let the keyboard lay out on my desk for a couple of hours to air dry.
The Result
After letting it dry out, I reassembled the keyboard and turned it back on. First thing I noticed, other than that it looked very clean, was that it was much quieter. Also the keys don’t seem to stick as much. Every once in awhile a key still sticks so I may have to try another cleaning cycle or perhaps some sort of grease, however it’s nowhere as bad as it used to be.
Personal Workout Challenge: September Performance – A Hard Transition
Oct 6th
Now that the hotter weather is behind us, September began cooling off quite a bit which cut my swimming short. I’ve been relying on an outdoor swimming pool for my exercises and since our nights started falling into 60’s and 70’s, the water started to become a bit on the cold side. I’ve tried to focus more on weights but it’s not really the same and I’m having a bit of a difficulty transitioning. Nonetheless, I’m making an effort.
I reached some of my goals but not others. The lack of progress stems from not getting into the habit of focusing more on weights. Perhaps I’ll consider signing up for a gym with an indoor pool. I honestly really do miss swimming and don’t know if I can wait till next summer to get back into it. In the mean time, I’m still making some progress.
| ABDMN | ARMS | CALF | CHEST | HIP | NECK | THIGH | WGHT | FAT% | |
|---|---|---|---|---|---|---|---|---|---|
| PREVIOUS | 32.25 | 11 | 12.75 | 38.0 | 35.25 | 14.0 | 20 | 127.6 | 10.3% |
| GOAL | 31.0 | 11.5 | 13.0 | 38.0 | 35.0 | 14.0 | 20.0 | 126.5 | <10.0% |
| ACTUAL | 32.0 | 11.0 | 12.75 | 36.75 | 35.5 | 14 | 19.25 | 125.8 | 9.8% |
See Complete Personal Fitness Log
Notes to Consider
- Although I dropped 0.25in in my abdomen, I failed to meet my goal by a long shot. Because of the transition from swimming, I’m doing less cardio and more weights/situps/pushups/etc so perhaps this might have something to do with it.
- I’ll admit, I must work a bit harder on my upper body strength. There was no noticeable increase in my arms. Overall since I’m doing a much different routine now, I’m not sure what type of adjustments I need to do to my goals. For example, I have no idea what’s going on with my chest. I measured three times just to double check but yes I did lose 1.25in while gaining 0.25 in my hips. Perhaps it’s the transition from swimming to what I’m doing now. Not exactly sure but it’s still resulting in a loss of weight that meets my goals.
- At this point, I’m about 50/50 positive that I’ll meet the end-of-year goal. It is a long shot but perhaps with getting my swimming back into my routine along with the weights will give me that boost I need.

Putting Things Into Perspective – Top 1% Average Wages vs Others
Sep 30th
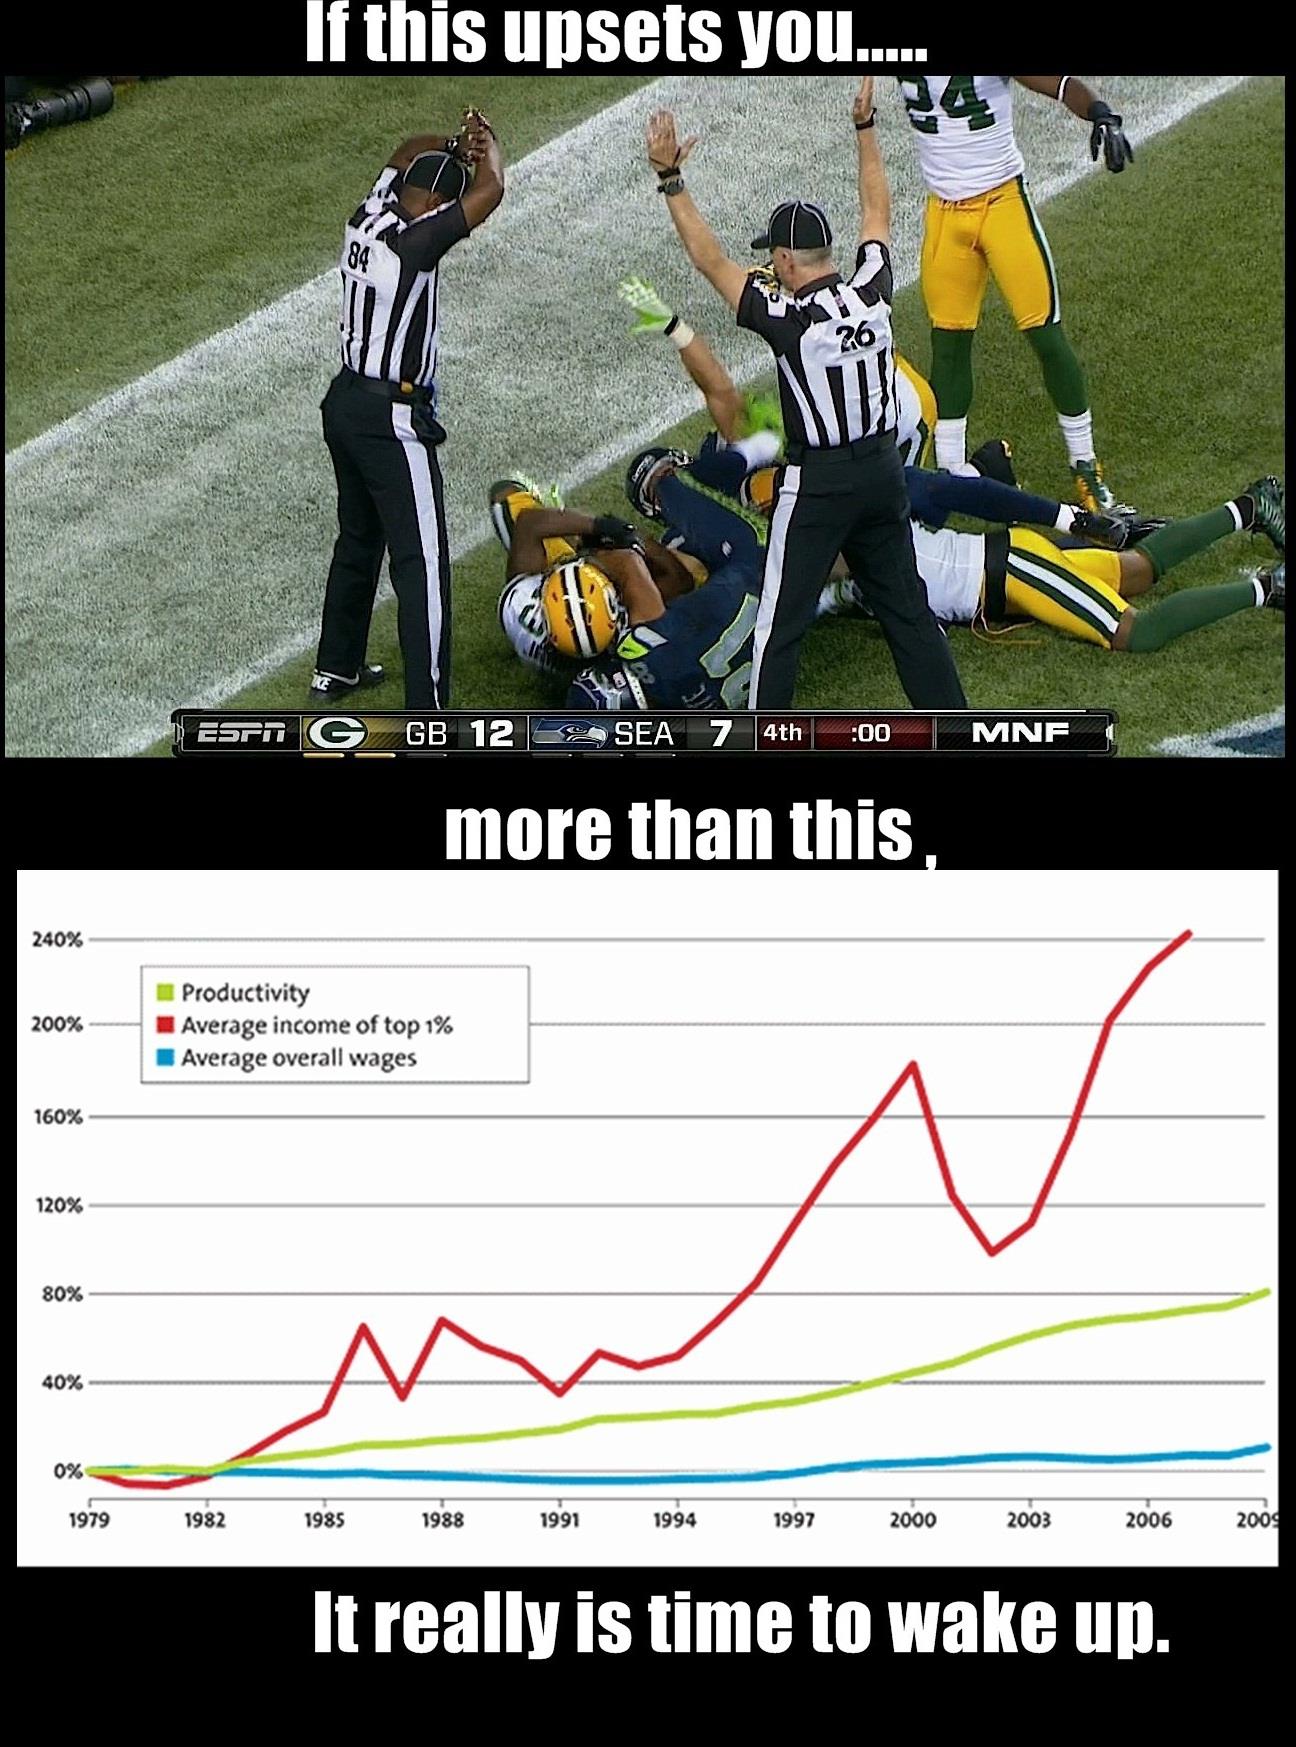
A friend recently shared this photo on Facebook from the Reaganomics, Raping America since 1981 Facebook Page that engaged me in further thought.
The photo was posted with the following listed as raw data sources: http://www.census.gov/
I took an interest on the statement the photo was proposing and further research caused me to respond.
First off… to be honest I’d say that I’m a moderate that slightly leans conservative but it really depends on the subject. When it comes to earnings, I’m a believer that we must take self-responsibility for our wealth. In the same light, the greater the risk the greater the reward should be.
Overall I couldn’t find a chart like the one posted in the photo in the raw data sources. I did find a similar chart in a recent news publication that for some reason used the “mean” of top 1% and the “median” of overall wages to compute the chart. There’s a big difference between mean and median. The fact that two methods were used to represent data in the same chart is misleading. Why is this important? Because even in the top 1%, there’s a big skew. According to Forbes, in the US, the richest person’s net worth is $66B; that’s almost 3x as much as the 10th richest. A median computation would take into account this kind of skewed data… a mean would not. I’m sorry, but this chart is misleading.
However, I’m not dismissing the general statement of this graph that top earners have had a greater increase in revenue than average households. I feel that further analysis is required to form a solid conclusion on the why. For example, the charts only take into account wages/earnings and not benefits (health insurance, vacation, expense accounts, etc) Nonetheless, greater risk should come with greater rewards. Let’s reference a chart found in the same source mentioned in raw sources (www.stateofworkingamerica.org)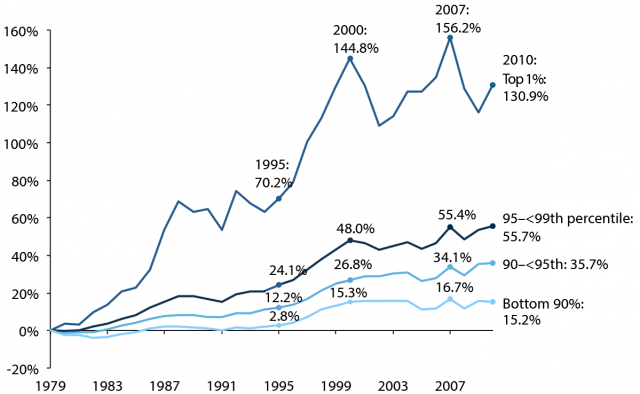 which shows a similar pattern as the graph in the first chart but the top line is not skewed. In addition, the later percentages are compounded by earlier years. I would like to take a relative measure to prove a point… from 2001 to about 2002, the top 1% had a decrease of about 30% in earnings while the <90% had no change in their wages. From 2000 to 2007, top 1% only had a 1% increase in earnings while <90% had a 9% increase. From 2007 to 2009, top 1% had a decrease of 16% while <90% had a decrease of 9%. In the lost decade, from 2000 to 2010, top 1% had a decrease of 9.5% in annual revenue while <90% had lost less than 1% (pretty much no change). I’m not denying the fact that top 1% have increasingly earned more, but the fluctuations for the top 1% are greater. Top 1% earners tend to be heavily invested in businesses and markets. These investments inherently carry great risk of potentially losing capital. <90% have the benefit of greater stability… you know that next year you’re not going to have a 30% decrease in your salary. I’m not saying it doesn’t happen, due to layoffs and salary reductions, but the possibility of it happening are less than the risk investors take. For example, in the Facebook IPO, those investors have lost about half. Imagine a top 1% making a $500,000 investment and within 6 months, losing $250,000.
I’m not outright defending one position or the other, but I feel that better context and analysis is needed when viewing these graphs. For example, productivity is highly influenced by the adoption of technology which would have an impact on business revenue and thus increase the earnings for investors but not so much for the employees.
Some might wonder why I’m defending the Top 1%. At heart, I’m an entrepreneur and capitalist. It’s not so much that I’m defending the top 1% as it is that I’m defending the principles of capitalism. A lot of what I’ve mentioned is impossible to communicate through just one graph. It’s something that requires in-depth analysis and discussion.
I encourage discussion of opposing views on political topics because through that process we learn, grow, and progress. Unfortunately our political system has broken down to one-liners, taking things out of context, and shock tactics which undermines understanding and growth. I blame both political parties for the mess we’re in. It seems that compromise and understanding has yielded to extreme polar opposite stances and exaggerated claims in order to fulfill political agendas.

Scottrade is Raising Fees and Adding a Transfer Fee
Sep 11th
Today I received a notification in my Scottrade account of a new brokerage commissions and fees schedule. According to their message:
Effective Oct. 1, 2012, we are updating our Commissions and Fee Schedule. Please note that no changes have been made to commissions for orders entered online.
Overall their statement is true. Price increases are seen for IVR phone system (almost doubling) and broker-assisted orders. Online stock and ETF orders remain at $7. Their mutual fund rates remain the same as well.
However if you look closely at their Service Fees, you’ll see an increase in many of their services plus one additional one: Account Transfer (Full Transfer) for $75.
Scottrade was not charging for account transfers till now. Don’t get me wrong, I still like Scottrade and they do have some of the lowest commissions out there. In addition, all the other major online brokerage firms were charging transfer fees already ranging from $60-$75:
- Schwab: $70 fee
- Ameritrade: $75 fee
- eTrade: $60
- Scottrade: $75 (used to be $0)
So it’s no surprise Scottrade decided to add a transfer fee. A transfer/closing fee would really only affect you if you were switching from one brokerage to another or closing out your account completely. I just found it interesting how there was no mention of the additional fee without digging into their fee schedule.
Overall I still enjoy Scottrade and won’t be switching. However I will be considering opening an account at Ameritrade given their extensive list of no-commission free ETF’s including Vanguard; I’m just not sure if I’ll be jumping into the ETF marketing any time soon. My portfolio has grown to the point where I feel I can diversify adequately and gain a better return than an ETF.
If you’re looking to getting started at Scottrade with some extra free trades, feel free to use my referral code:

Sometimes a Deal isn’t a Deal on Daily Deal Sites Like Groupon and LivingSocial
Sep 2nd
I just received an email on today’s LivingSocial Deal for a “Shazzam Tsunami Rechargeable Electric Hydroflosser with Included Shipping“:
LivingSocial claims a 72% savings. So you would think this is definitely a great deal. Imagine getting something for $64 that was originally $231. However this is clear deception because I found the exact same product on Amazon.com for less… a lot less… almost half of the LivingSocial deal.
You can get the Professional Rechargeable Oral Irrigator with High Capacity Water Tank by ToiletTree Products on Amazon.com for a mere $39.95.
As the group discount sites deal with slower traffic and businesses that are realizing that it may not be to their benefit, they’re are desperately trying to turn an income by no longer delivering value to their target base; which ironically will be the demise of these group coupon sites. I feel for the 142 and counting people who have purchased the inferior LivingSocial Deal.
Recently I’ve turned my attention to FatWallet who’s overall goal is to deliver value to their target base. I also found a very strong community of people who are actively looking for value in their purchases. I would say, put these “Groupon” sites on the backburner and give FatWallet a try… perhaps you’ll find real value instead of a “deal” that’s not really a deal.

